

According to Mitchell International’s Plugged-In: EV Collision Insights report for the second quarter of 2024, battery electric vehicles (BEVs) continue to be more expensive to repair compared to internal combustion engine (ICE) vehicles, while at the same time the frequency of damage to BEVs continues to rise.
The loss frequency for repairable BEVs increased 45% year-on-year in the US and 39% in Canada, while it increased more slowly for hybrids.
The issue focuses on the latest U.S. and Canadian claims data on BEVs, mild hybrid electric vehicles (MHEVs), and plug-in hybrid electric vehicles (PHEVs), showing how differences in complexity and design impact claim costs and repair labor.
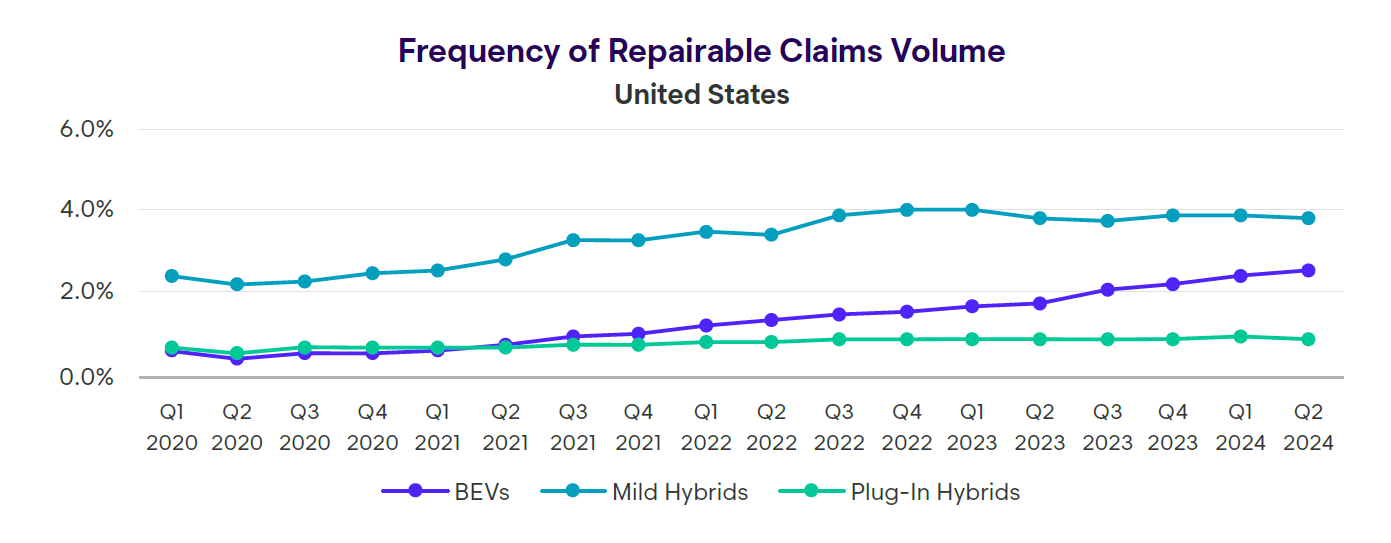
“Although BEV sales have slowed in 2024, sales of mild and plug-in hybrid cars remain strong,” said Ryan Mandell, Mitchell’s director of claims operations, in a press release. “As with BEVs, these vehicles can be more expensive to repair after an accident than their internal combustion engine or ICE counterparts. However, because mild hybrids have both an ICE and a small electric battery, they are remarkably similar to gasoline-only cars in terms of claim levels.”

Mandell noted that hybrid vehicle sales remain “robust.” He cited PwC, which reported a 69.7% increase in PHEV sales last quarter compared to the first quarter of 2023. He also cited S&P Global, which said there was a 75% increase in new PHEV registrations in Canada in the first quarter.
In the second quarter of 2024, the average claim amount for repairable MHEVs was $4,726 in the U.S. and $5,302 in Canada. For internal combustion engine vehicles, it was $4,806 in the U.S. and $4,958 in Canada—a difference of $80 and $344, respectively.
Because PHEVs require a larger, high-voltage battery in addition to a secondary combustion engine, their average price is closer to BEVs, at $5,059 versus $5,753 in the U.S. and $5,665 versus $6,534 in Canada, according to the report.
The overall loss frequency of BEVs compared to 2021 model year ICE vehicles and newer ICE vehicles remains similar in terms of complexity and repair costs at 9.16% in the U.S. versus 9.45%. In Canada, the loss frequency for BEVs and ICE vehicles is 7.24% versus 8.52%.
In collision damage estimates for BEVs, the average number of mechanical labor hours is higher than in estimates for internal combustion engines (5.21% compared to 8.18%), but frame labor is less frequently included.
The lower amount of frame labor in the estimates for BEVs could mean their design is more effective at preventing the vehicle’s structural components from being damaged by impact energy, Mandell wrote in the report. However, he said the statistic refers to work coded as “frame labor.” While it likely excludes “structural” work, it depends on how the shop or estimator writes the estimate, Mandell said.
“This lower frequency suggests that electric vehicle design may be more effective at preventing the vehicle’s structural components from being damaged by impact energy. Although further studies are needed to determine the true cause of this delta, this could be one aspect of electric vehicle engineering that bodes well for future repairability.”
OEM parts continue to be used more frequently in BEV repairs – accounting for an estimated 89% of parts costs, compared to 65% for internal combustion engine vehicles.
To view the Q2 2024 report and prior reports, visit mitchell.com/plugged-in.
A new study by JD Power found that public electric vehicle charging infrastructure continues to be a reason for the “unexpectedly slow” adoption of electric vehicles in the US
However, JD Power says there are signs of improvement, with overall satisfaction increasing for the second consecutive quarter.
“The number of public charging stations across the country continues to grow, but has not kept pace with the rate of sales of electric vehicles,” JD Power said. “In recent years, the increase in the number of electric vehicles per public charging station has led to declining satisfaction with these chargers. However, this year, customer satisfaction with the two main methods of public charging is a hopeful sign.”
Satisfaction with direct current (DC) fast chargers has increased to 664 on a 1,000-point scale, an increase of 10 points from the same period in 2023. Satisfaction with Level 2 charging has decreased to 614 – a decrease of 3 points from last year.
“While customer satisfaction scores for public charging stations remain a concern, the results provide cause for optimism,” said Brent Gruber, executive director of JD Power EV Practice, in a press release. “For Level 2 charger users, satisfaction improves in five of the 10 factors that make up overall satisfaction, and for DC fast charger users, satisfaction increases in six of the 10 categories.”
“In addition, the overall indices have improved over the past two quarters, indicating progress in many areas that are important to electric vehicle owners, such as the speed and availability of fast chargers and the convenience of being able to do other things during longer Level 2 charging sessions.”
JD Power suspects that access to the Tesla Supercharger network by non-Tesla owners is contributing to the increasing satisfaction with DC fast chargers.
Nineteen percent of electric vehicle owners surveyed in the study said they had visited a charging station but were unable to charge their vehicle, an improvement of just one percentage point from 2023. According to JD Power, the most prevalent problem nationwide is out-of-service or non-functioning charging stations.
Pictures
Featured image: gerenme/iStock
Graphics provided by Mitchell International
Split:
